
How to configure XDebug, PHPStorm, and DrupalVM to debug Drupal migrations via Drush commands and the browser?
In recent articles, we have presented some recommendations and tools to debug Drupal migrations. Using a proper debugger is definitely the best way to debug Drupal be it migrations or other substems. In today’s article we are going to learn how to configure XDebug inside DrupalVM to connect to PHPStorm. First, via the command line using Drush commands. And then, via the user interface using a browser. Let’s get started.
Important: User interfaces tend to change. Screenshots and referenced on-screen text might be differ in new versions of the different tools. They can also vary per operating system. This article uses menu items from Linux. Refer the the official DrupalVM documentation for detailed installation and configuration instructions. For this article, it is assumed that VirtualBox, Vagrant, and Ansible are already installed. If you need help with those, refer to the DrupalVM’s installation guide.
Getting DrupalVM
First get a copy of DrupalVM by cloning the repository or downloading a ZIP or TAR.GZ file from the available releases. If you downloaded a compressed file, expand it to have access to the configuration files. Before creating the virtual machine, make a copy of `default.config.yml` into a new file named `config.yml`. The latter will be used by DrupalVM to configure the virtual machine (VM). In this file make the following changes:
# config.yml file
# Based off default.config.yml
vagrant_hostname: migratedebug.test
vagrant_machine_name: migratedebug
# For dynamic IP assignment the 'vagrant-auto_network' plugin is required.
# Otherwise, use an IP address that has not been used by any other virtual machine.
vagrant_ip: 0.0.0.0

# All the other extra packages can remain enabled.
# Make sure the following three get installed by uncommenting them.
installed_extras:
  - drupalconsole
  - drush
  - xdebug

php_xdebug_default_enable: 1
php_xdebug_cli_disable: no
The `vagrant_hostname` is the URL you will enter in your browser’s address bar to access the Drupal installation. Set `vagrant_ip` to an IP that has not been taken by another virtual machine. If you are unsure, you can set the value to `0.0.0.0` and install the `vagrant-auto_network` plugin. The plugin will make sure that an available IP is assigned to the VM. In the `installed_extras` section, uncomment `xdebug` and `drupalconsole`. Drupal Console is not necessary for getting XDebug to work, but it offers many code introspection tools that are very useful for Drupal debugging in general. Finally, set `php_xdebug_default_enable` to `1` and `php_xdebug_cli_disable` to `no`. These last two settings are very important for being able to debug Drush commands.
Then, open a terminal and change directory to where the DrupalVM files are located. Keep the terminal open are going to execute various commands from there. Start the virtual machine by executing `vagrant up`. If you had already created the VM, you can still make changes to the `config.yml` file and then reprovision. If the virtual machine is running, execute the command: `vagrant provision`. Otherwise, you can start and reprovision the VM in a single command: `vagrant up –provision`. Finally, SSH into the VM executing `vagrant ssh`.
By default, DrupalVM will use the Drupal composer template project to get a copy of Drupal. That means that you will be managing your module and theme dependencies using composer. When you SSH into the virtual machine, you will be in the `/var/www/drupalvm/drupal/web` directory. That is Drupal’s docroot. The composer file that manages the installation is actually one directory up. Normally, if you run a composer command from a directory that does not have a composer.json file, composer will try to find one up in the directory hierarchy. Feel free to manually go one directory up or rely on composer’s default behaviour to locate the file.
For good measure, let’s install some contributed modules. Inside the virtual machine, in Drupal’s docroot, execute the following command: `composer require drupal/migrate_plus drupal/migrate_tools`. You can also create directory in `/var/www/drupalvm/drupal/web/modules/custom` and place the custom module we have been working on throughout the series. You can get it at https://github.com/dinarcon/ud_migrations.
To make sure things are working, let’s enable one example modules by executing: `drush pm-enable ud_migrations_config_entity_lookup_entity_generate`. This module comes with one migration: `udm_config_entity_lookup_entity_generate_node`. If you execute `drush migrate:status` the example migration should be listed.
Configuring PHPStorm
With Drupal already installed and the virtual machine running, let’s configure PHPStorm. Start a new project pointing to the DrupalVM files. Feel free to follow your preferred approach to project creation. For reference, one way to do it is by going to “Files > Create New Project from Existing Files”. In the dialog, select “Source files are in a local directory, no web server is configured yet.” and click next. Look for the DrupalVM directory, click on it, click on “Project Root”, and then “Finish”. PHPStorm will begin indexing the files and detect that it is Drupal project. It will prompt you to enable the Drupal coding standards, indicate which directory contains the installation path, and if you want to set PHP include paths. All of that is optional but recommended, especially if you want to use this VM for long term development.
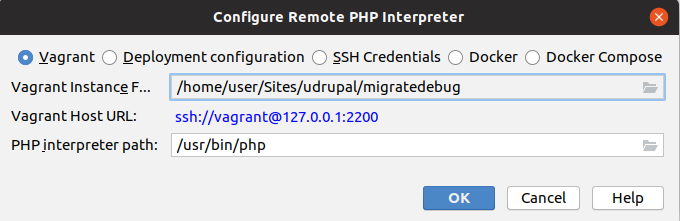
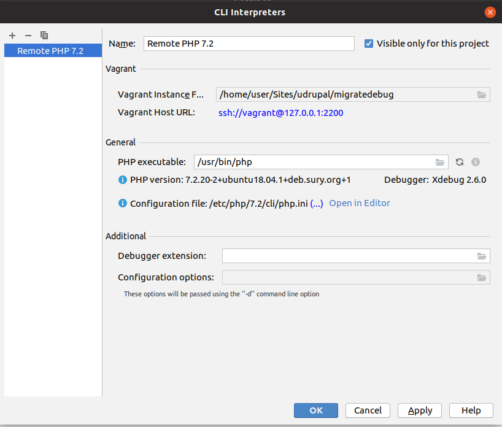
Now the important part. Go to “Files > Settings > Language and Frameworks > PHP”. In the panel, there is a text box labeled “CLI Interpreter”. In the right end, there is a button with three dots like an ellipsis (…). The next step requires that the virtual machine is running because PHPStorm will try to connect to it. After verifying that it is the case, click the plus (+) button at the top left corner to add a CLI Interpreter. From the list that appears, select “From Docker, Vagrant, VM, Remote…”. In the “Configure Remote PHP Interpreter” dialog select “Vagrant”. PHPStorm will detect the SSH connection to connect to the virtual machine. Click “OK” to close the multiple dialog boxes. When you go back to the “Languages & Frameworks” dialog, you can set the “PHP language level” to match the same version from the Remote CLI Interpreter.
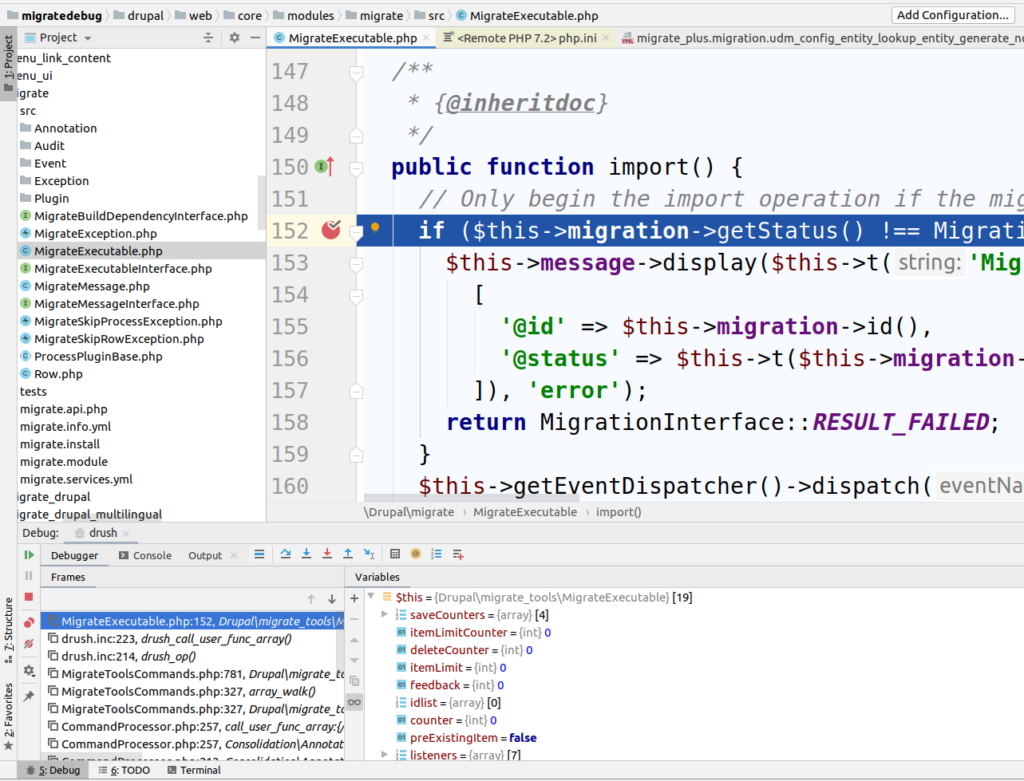
You are almost ready to start debugging. There are a few things pending to do. First, let’s create a breakpoint in the `import` method of the MigrateExecutable class. You can go to “Navigate > Class” to the project by class name. Or click around in the Project structure until you find the class. It is located at `./drupal/web/core/modules/migrate/src/MigrateExecutable.php` in the VM directory. You can add a breakpoint by clicking on the bar to the left of the code area. A red circle will appear indicating that the breakpoint has been added.
Then, you need to instruct PHPStorm to listen for debugging connections. For this, click on “Run > Start Listening for PHP Debugging Connections”. Finally, you have to set some server mappings. For this you will need the IP address of the virtual machine. If you configured the VM to assign the IP dynamically, you can skip this step momentarily. PHPStorm will detect the incoming connection, create a server with the proper IP, and then you can set the path mappings.
Triggering the breakpoint
Let’s switch back to the terminal. If you are not inside the virtual machine, you can SSH into the VM executing `vagrant ssh`. Then, execute the following command (everything in one line):
XDEBUG_CONFIG=”idekey=PHPSTORM” /var/www/drupalvm/drupal/vendor/bin/drush migrate:import udm_config_entity_lookup_entity_generate_node
For the breakpoint to be triggered, the following needs to happen:
- You must execute Drush from the `vendor` directory. DrupalVM has a globally available Drush binary located at `/usr/local/bin/drush`. That is not the one to use. For debugging purposes, always execute Drush from the `vendor` directory.
- The command needs to have `XDEBUG_CONFIG` environment variable set to “idekey=PHPSTORM”. There are many ways to accomplish this, but prepending the variable as shown in the example is a valid way to do it.
- Because the breakpoint was set in the import method, we need to execute an import command to stop at the breakpoint. The migration in the example Drush command is part of the example module that was enabled earlier.
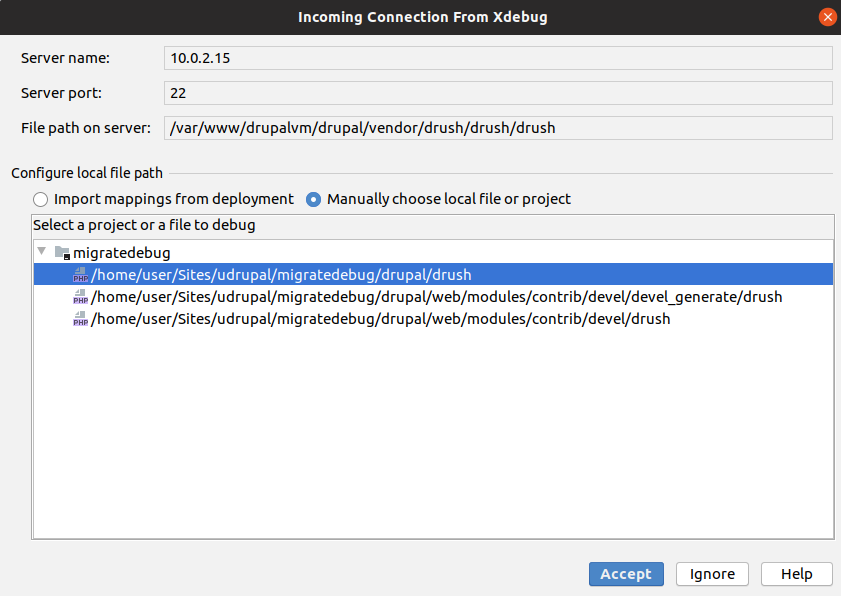
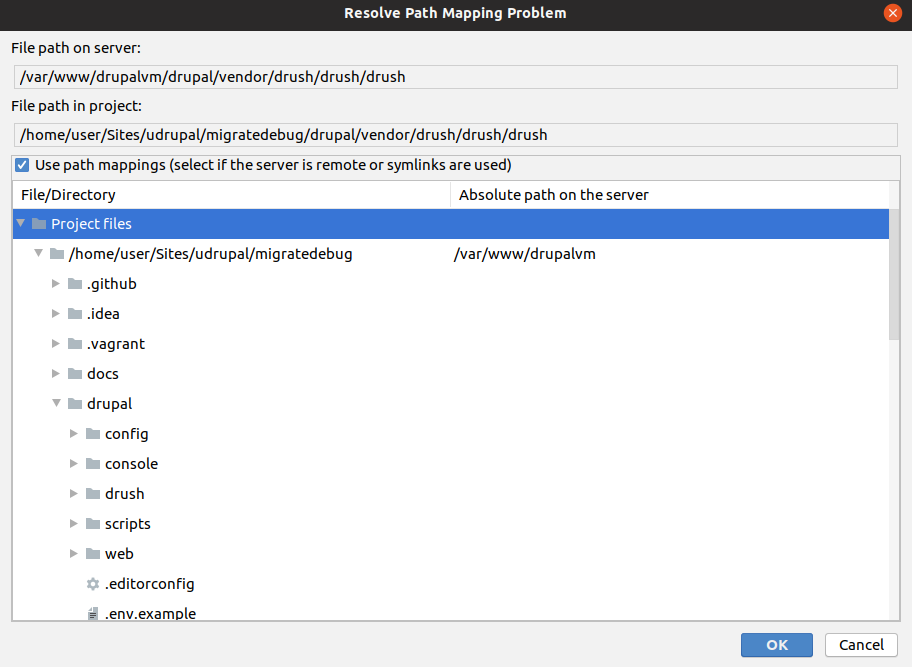
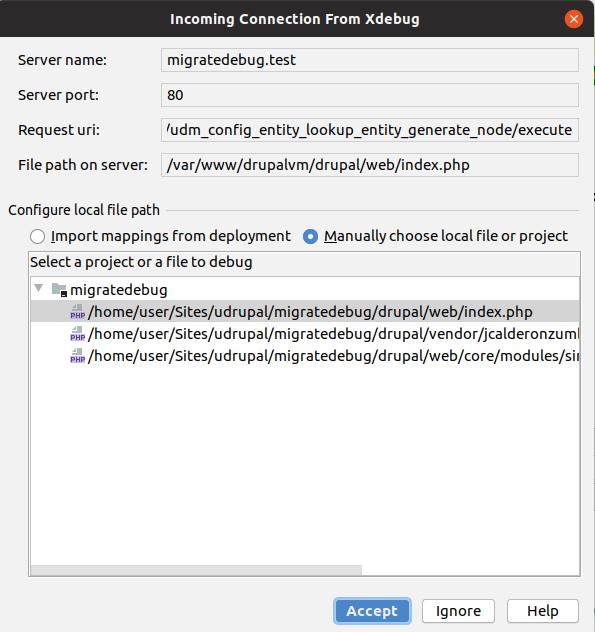
When the command is executed, a dialog will appear in PHPStorm. In it, you will be asked to select a project or a file to debug. Accept what is selected by default for now. By accepting the prompt a new server will be configured using the proper IP of the virtual machine. After doing so, go to “Files > Settings > Language and Frameworks > PHP > Servers”. You should see one already created. Make sure the “Use path mappings” option is selected. Then, look for the direct child of “Project files”. It should be the directory in your host computer where the VM files are located. In that row, set the “Absolute path on the server” column to `/var/www/drupalvm`. You can delete any other path mapping. There should only be one from the previous prompt. Now, click “OK” in the dialog to accept the changes.
Finally, run the Drush command from inside the virtual machine once more. This time the program execution should stop at the breakpoint. You can use the Debug panel to step over each line of code and see how the variables change over time. Feel free to add more breakpoints as needed. In the previous article there are some suggestions about that. When you are done, let PHPStorm know that it should no longer listen for connections. For that, click on “Run > Stop Listening for PHP Debugging Connections”. And that is how you can debug Drush commands for Drupal migrations.
Debugging from the user interface
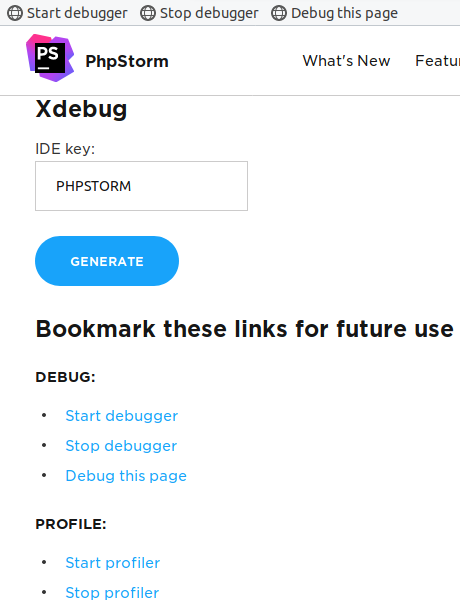
If you also want to be able to debug from the user interface, go to this URL and generate the bookmarlets for XDebug: https://www.jetbrains.com/phpstorm/marklets/ The `IDE Key` should be `PHPSTORM`. When the bookmarlets are created, you can drag and drop them into your browser’s bookmarks toolbar. Then, you can click on them to start and stop a debugging session. The IDE needs to be listening for incoming debugging connections as it was the case for Drush commands.
Note: There are browser extensions that let you start and stop debugging sessions. Check the extensions repository of your browser to see which options are available.
Finally, set breakpoints as needed and go to a page that would trigger them. If you are following along with the example, you can go to http://migratedebug.test/admin/structure/migrate/manage/default/migrations/udm_config_entity_lookup_entity_generate_node/execute Once there, select the “Import” operation and click the “Execute” button. This should open a prompt in PHPStorm to select a project or a file to debug. Select the `index.php` located in Drupal’s docroot. After accepting the connection a new server should be configured with the proper path mappings. At this point, you should hit the breakpoint again.
Happy debugging! 🙂
What did you learn in today’s blog post? Did you know how to debug Drush commands? Did you know how to trigger a debugging session from the browser? Share your answers in the comments. Also, I would be grateful if you shared this blog post with others.